OPF diagrams
A diagram is a diagram written as text. You write Mermaid source, and the engine draws it in the deck's own fonts and colors, so a flowchart, a sequence of messages or a mind map looks like the rest of the slide and not like a pasted screenshot. It is a content kind like chart or table: it can be a slide's root content, a block, or the content of a layout region that accepts it, and it takes a caption. The drawing comes from pele, an MIT-licensed engine with no runtime dependencies that runs without a DOM.
When to use a diagram
Choose the content kind by what the content is, not by how it should look.
- Steps, decisions, systems and how they connect, messages between parties, states, hierarchies or an entity model:
diagram. - Numbers on axes or shares of a whole whose values should stay editable data:
chart. - Dated milestones with progress:
timeline. A short list of steps: a list or the process layout.
Payload forms
A string is shorthand for { "source": value }. The object form adds alt, the text alternative, and syntax (mermaid, the default and the only value today).
JSON
{
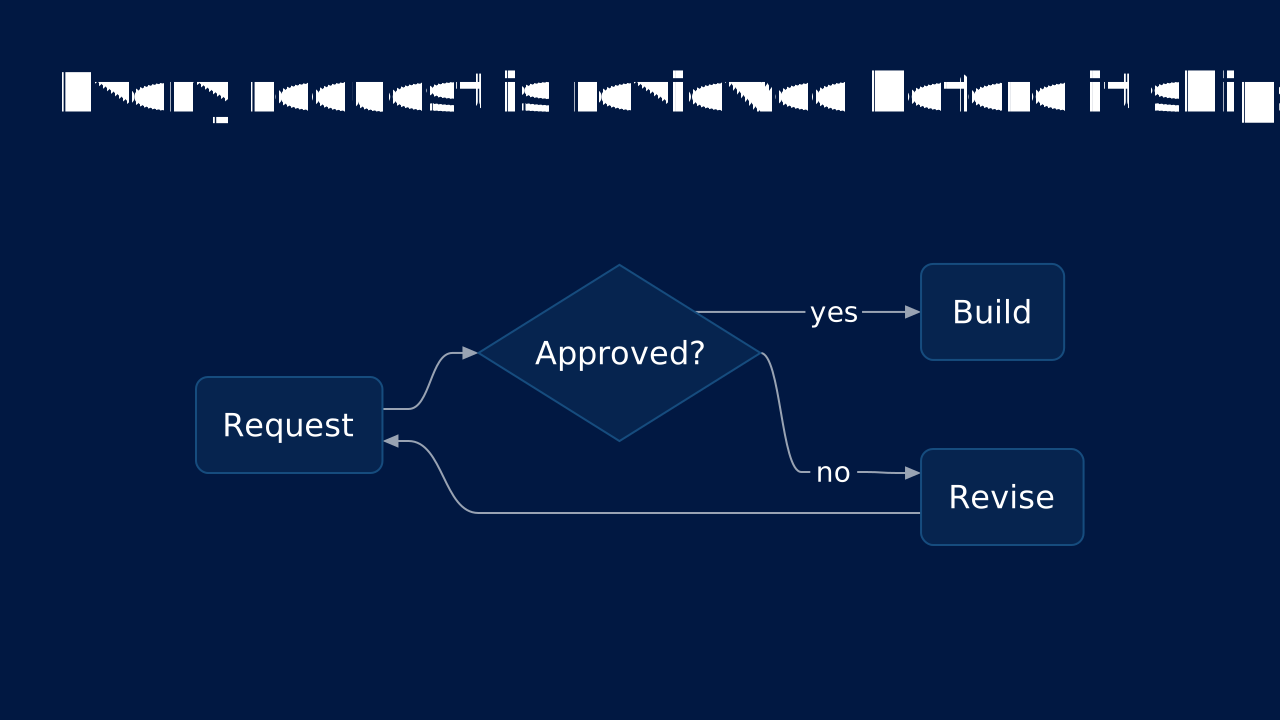
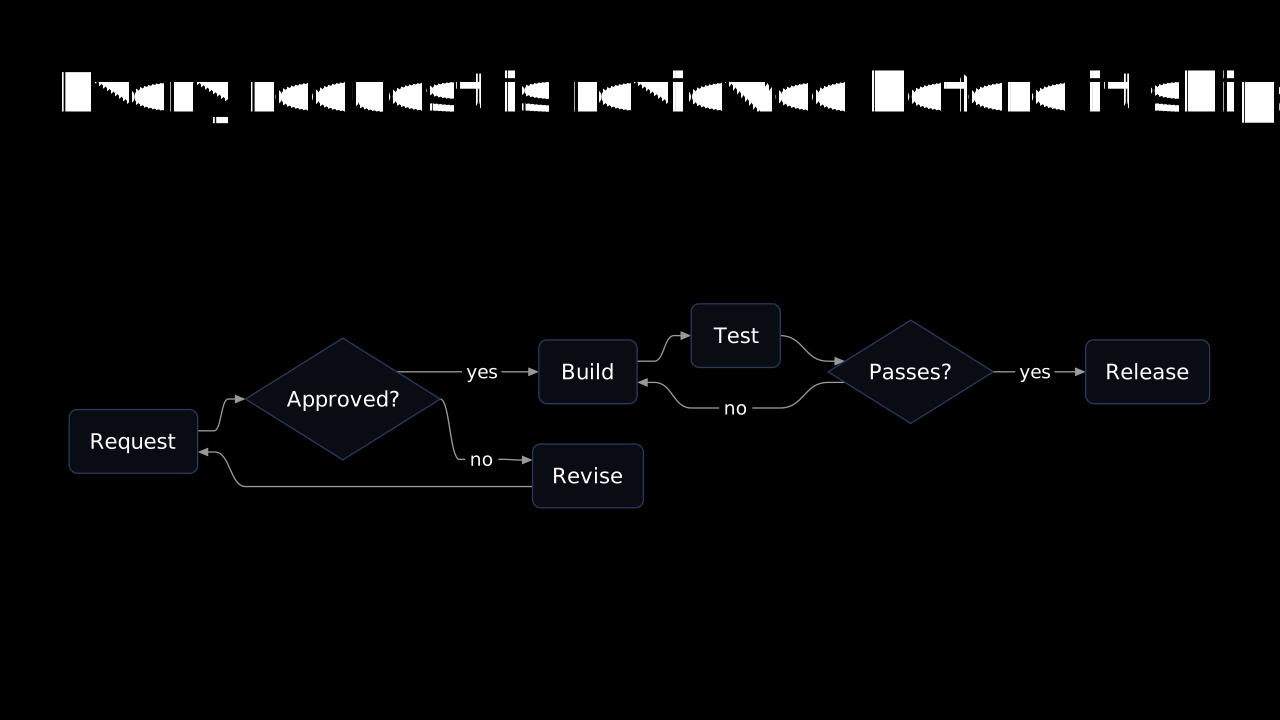
  "title": "Every request is reviewed before it ships",
  "diagram": "flowchart LR\n  A[Request] --> B{Approved?}\n  B -->|yes| C[Build]\n  B -->|no| D[Revise]\n  D --> A"
}
With an alt and a caption:
{
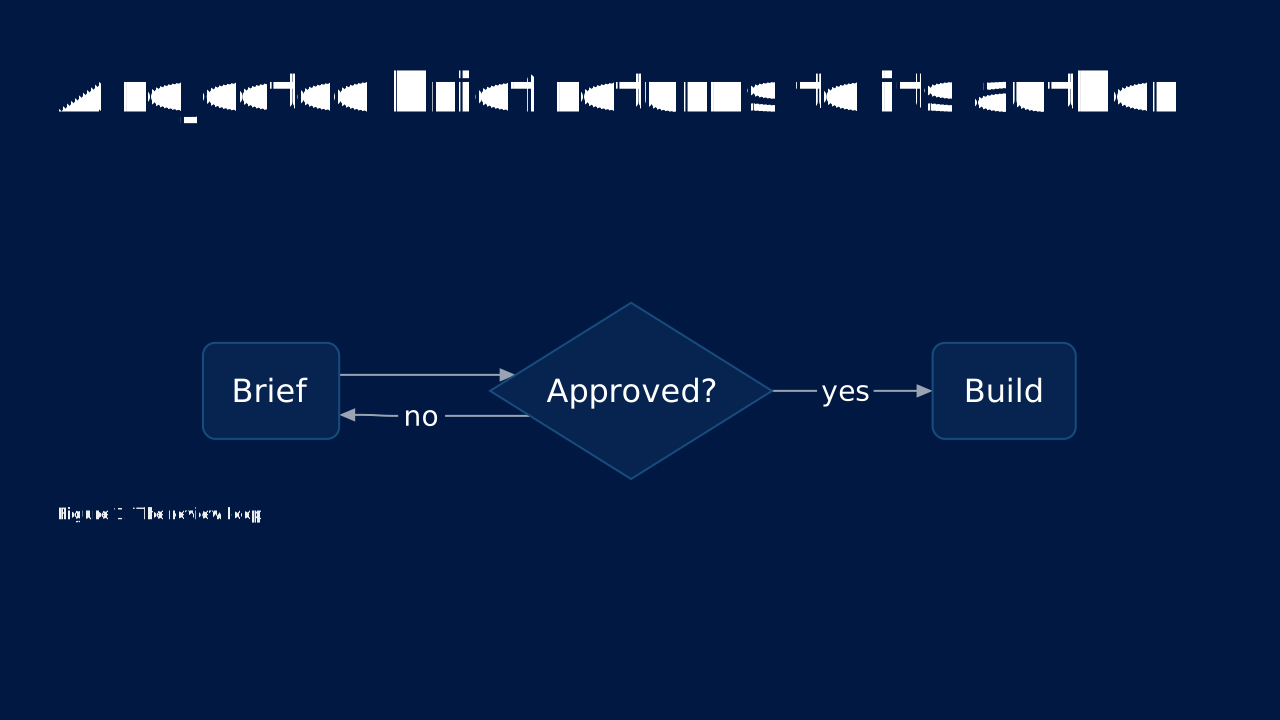
  "title": "A rejected brief returns to its author",
  "diagram": {
    "source": "flowchart LR\n  A[Brief] --> B{Approved?}\n  B -->|yes| C[Build]\n  B -->|no| A",
    "alt": "A brief goes to review. Approved work is built; rejected work returns to the brief."
  },
  "caption": "Figure 1. The review loop"
}
Beside text, give the slide blocks; the diagram takes its own cell:
{
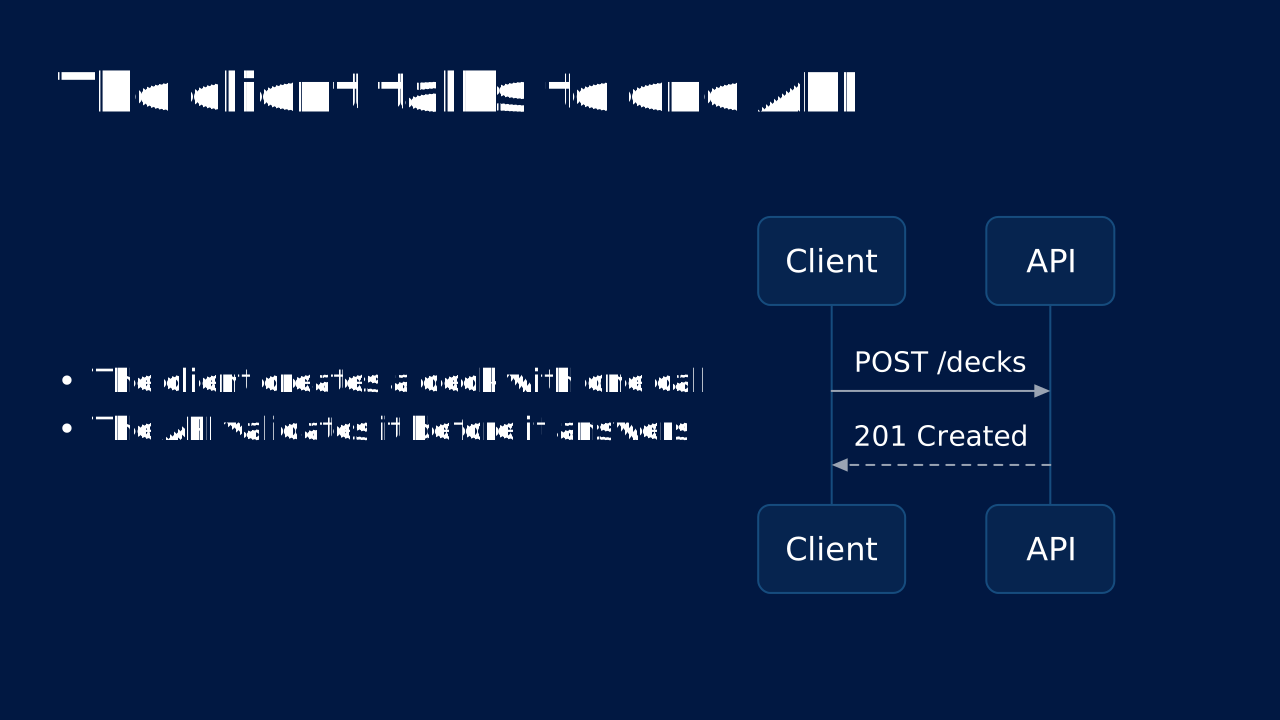
  "title": "The client talks to one API",
  "blocks": [
    { "bullets": ["The client creates a deck with one call", "The API validates it before it answers"] },
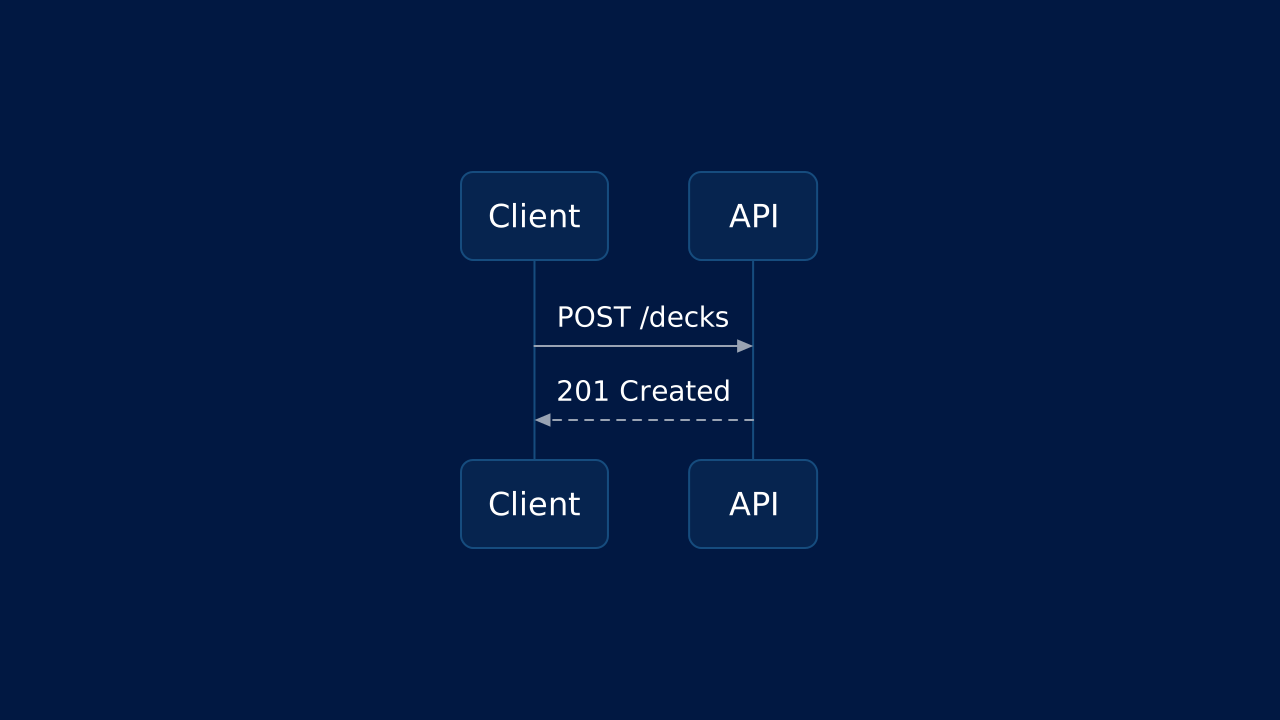
    { "diagram": "sequenceDiagram\n  Client->>API: POST /decks\n  API-->>Client: 201 Created" }
  ]
}
YAML
A block scalar keeps the source readable:
- title: Every request is reviewed before it ships
  diagram:
    alt: A request is approved or revised, then built.
    source: |-
      flowchart LR
        A[Request] --> B{Approved?}
        B -->|yes| C[Build]
        B -->|no| D[Revise]
        D --> A
Markdown
A fenced block whose info word is mermaid is a diagram. An optional alt="..." after the word is its text alternative. Writing the deck back to Markdown produces the same fence, so the round trip is lossless.
# Every request is reviewed before it ships

```mermaid alt="A request is approved or revised, then built."
flowchart LR
  A[Request] --> B{Approved?}
  B -->|yes| C[Build]
  B -->|no| D[Revise]
  D --> A
```
Mermaid families
The first line of the source names the family. All of Mermaid's built-in families are supported, plus several newer ones; ZenUML is not supported. Pele follows Mermaid 12.1 syntax but has its own layout and drawing, so a diagram does not match the pixels of mermaid.js. Check it in the preview, not in Mermaid's live editor.
| Family | First line |
|---|---|
| Flowchart | flowchart LR |
| Sequence | sequenceDiagram |
| Class | classDiagram |
| State | stateDiagram-v2 |
| Entity relationship | erDiagram |
| Gantt | gantt |
| Pie | pie |
| Quadrant | quadrantChart |
| Mind map | mindmap |
| Timeline | timeline |
| User journey | journey |
| XY chart | xychart |
| Sankey | sankey |
| Git graph | gitGraph |
| C4 | C4Context |
| Block | block |
| Architecture | architecture-beta |
| Kanban | kanban |
| Packet | packet |
| Radar | radar-beta |
| Treemap | treemap |
| Venn | venn-beta |
| Ishikawa | ishikawa-beta |
| Requirement and more | requirementDiagram |
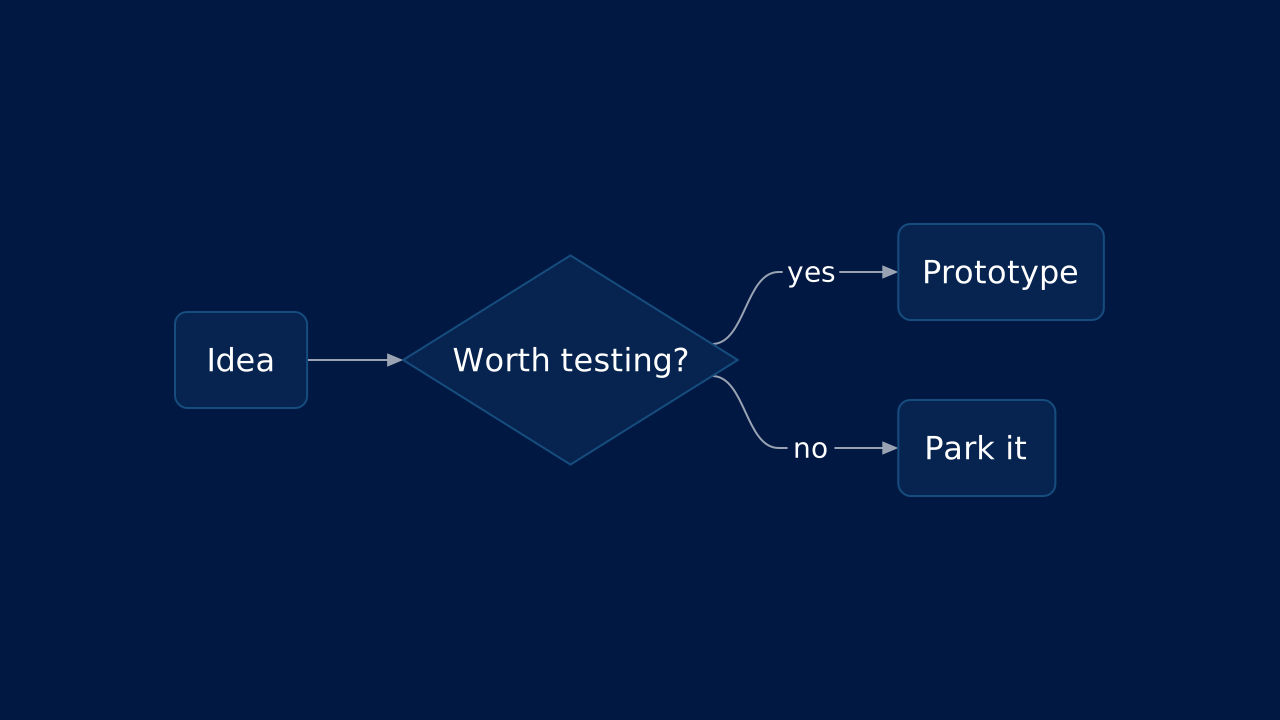
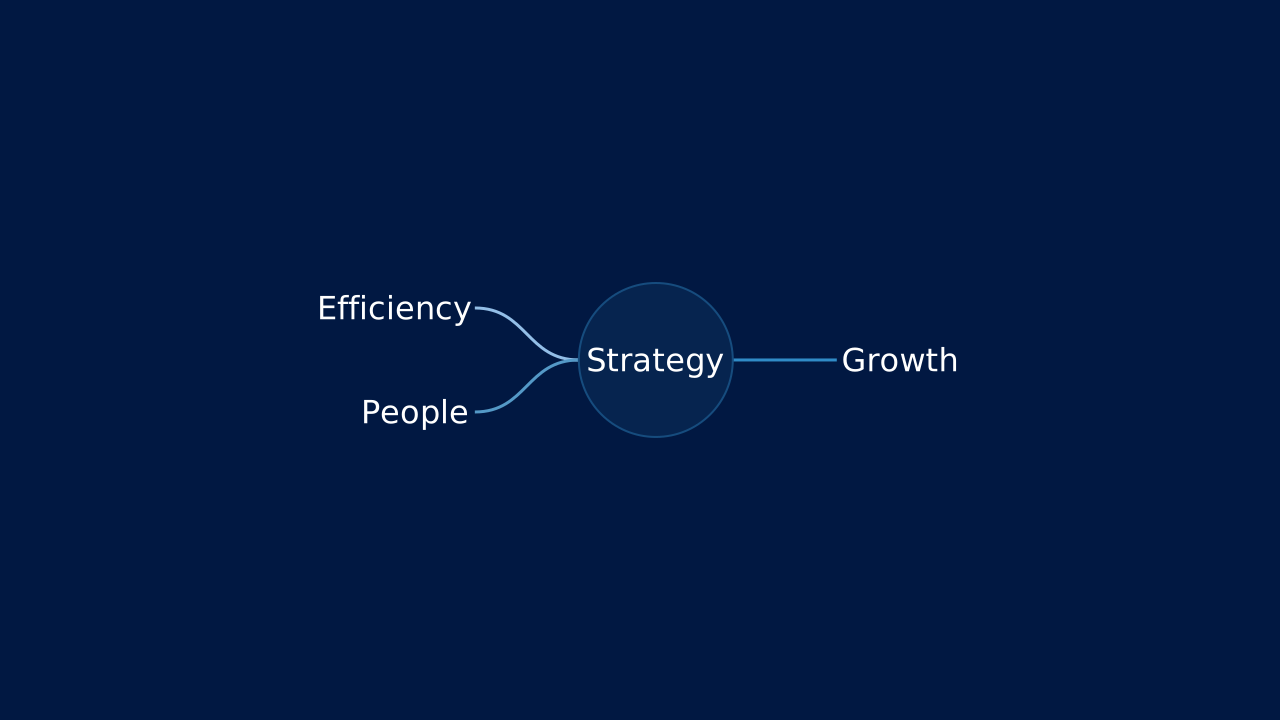
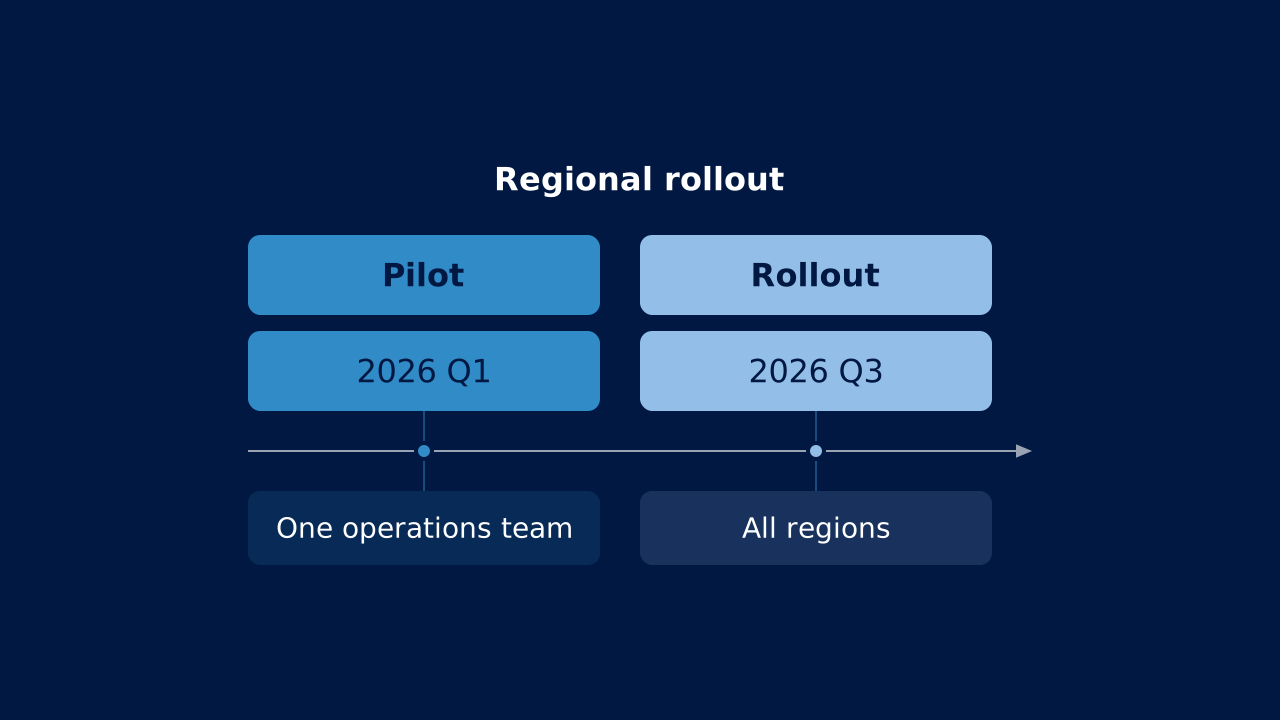
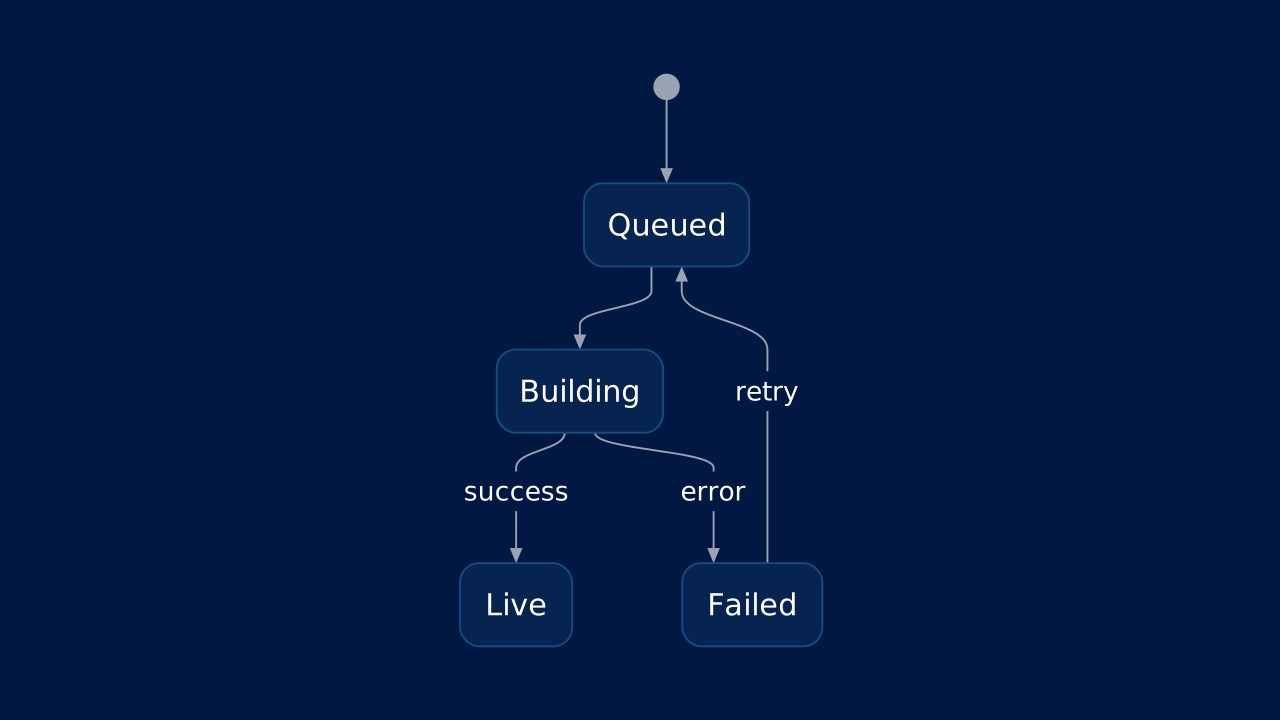
Six of them, drawn in the default design (the sources are in the OPF diagram guide):
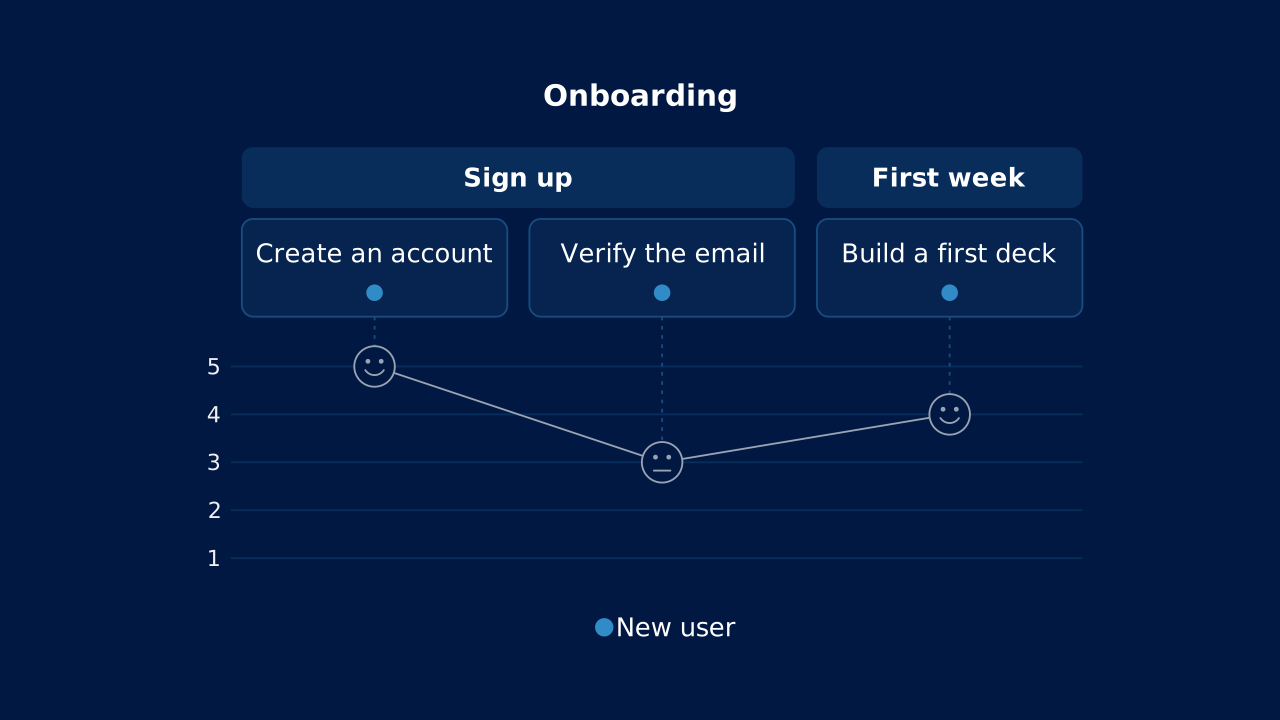
How the deck styles a diagram
- Node fills are tints of the slide's accent colors, mixed over the card or background the diagram sits on.
- Series (pie slices, chart series, mind map branches) use the same palette as the slide's charts.
- Labels use the font scheme's body font, and code-like labels its code font, with 4.5:1 contrast against the fill.
- Dark variants and color maps adapt with no change to the source. Mermaid's own theming (
%%{init}%%, themes and click callbacks) is ignored. Leave authoredstyleandclassDefcolors out and let the deck decide.
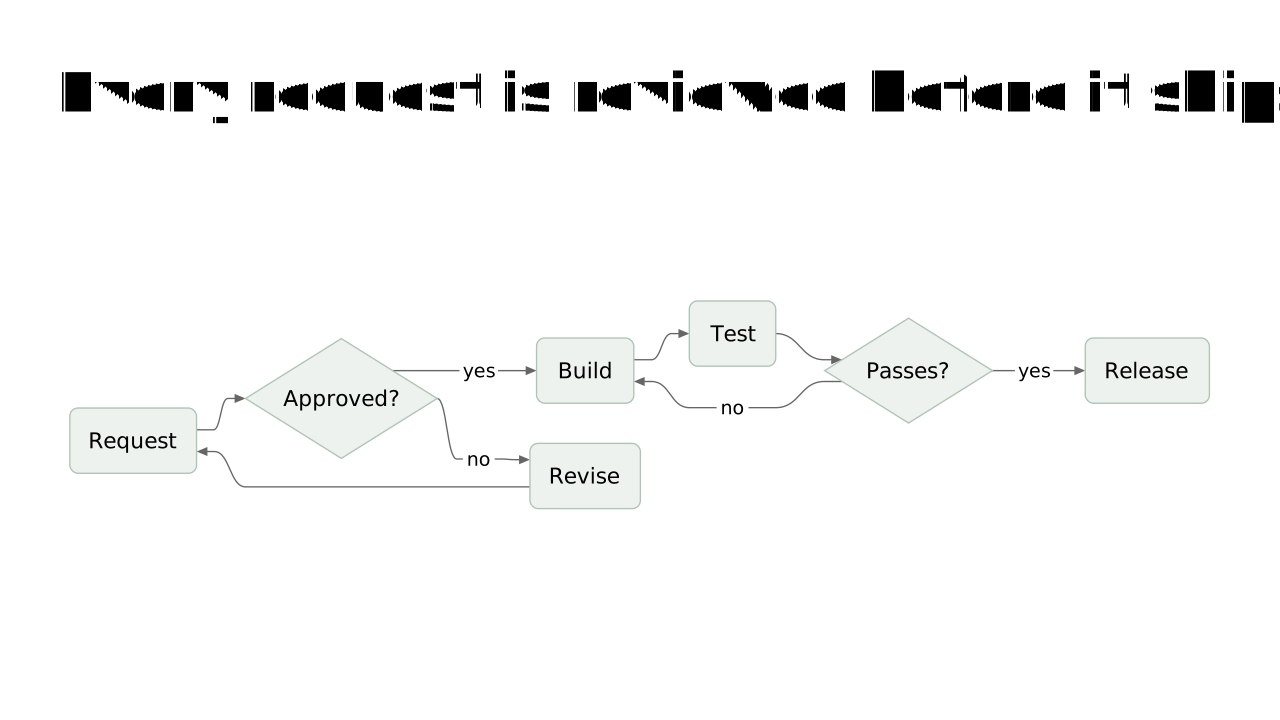
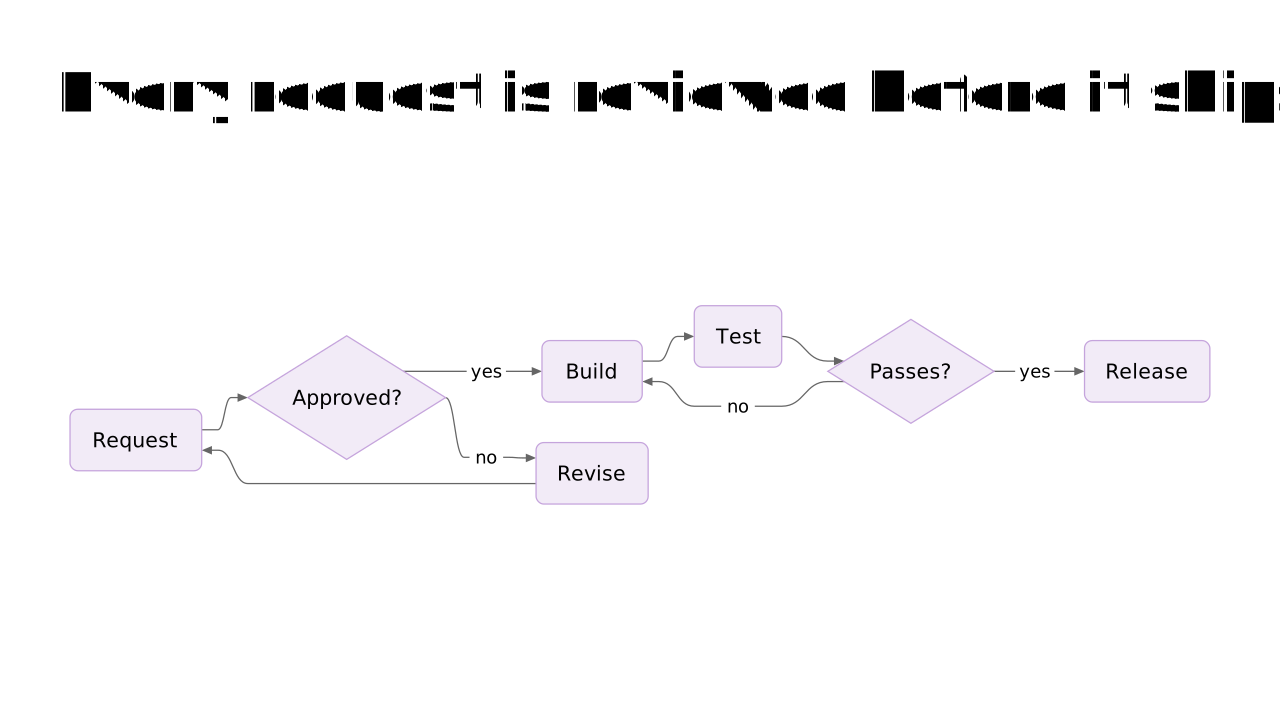
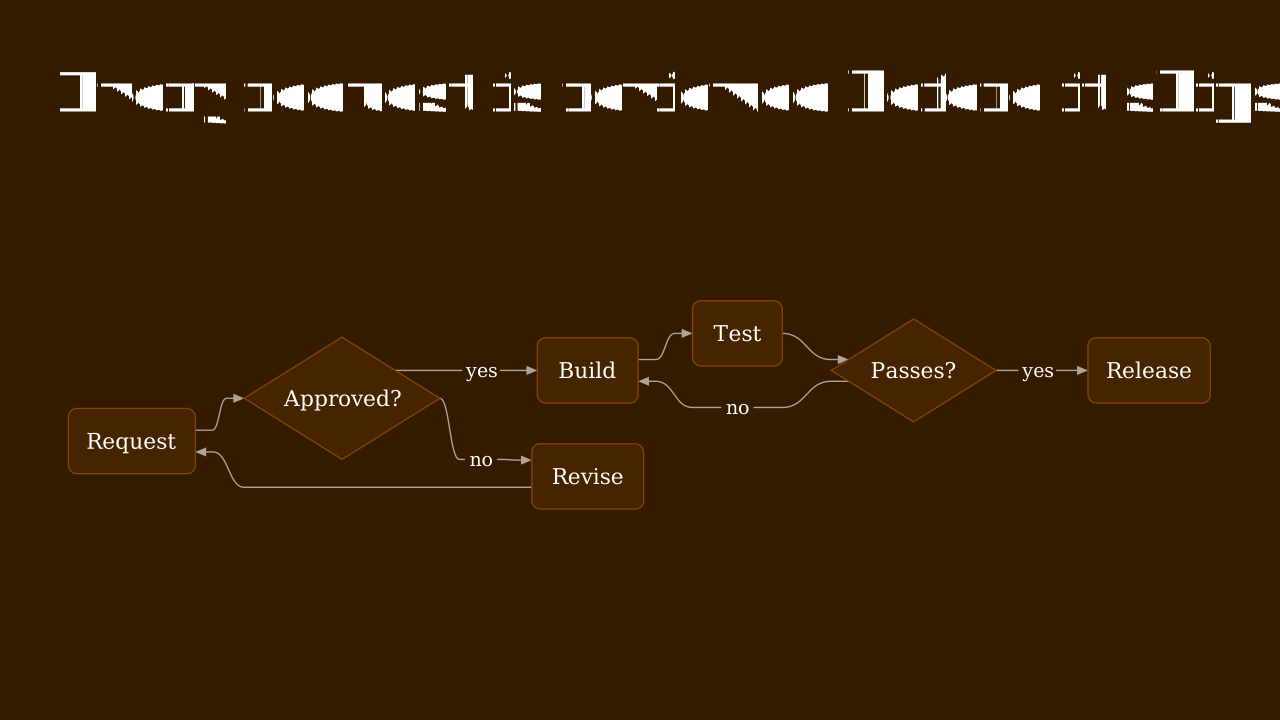
The same flowchart source in four designs from the default catalog (theme, color scheme, font scheme):
Sizing
The engine tries the largest size that fits the block, so a small diagram grows and a large one steps down. Labels never go below the readability floor. A smaller size is a new layout, not a shrunken picture, so a wide flowchart may turn to run downward. When a diagram cannot fit even at the floor, the slide reports a text-overflow finding. Fix it in the content: give the diagram a region of its own, draw it the other way (flowchart TB for LR), split it, or shorten the labels.
Accessibility
alt should say what the diagram shows, not that it is a diagram. Without it the engine derives one from the diagram type and its labels. The preview draws the diagram as one image with that text, and the PowerPoint export writes it as the picture's description.
Exports
- SVG preview: vector shapes and text in the slide's colors and fonts.
- PNG and PDF: the preview rasterized, or vector with selectable labels.
- PowerPoint: a native SVG picture over a PNG fallback, with the alt as its description. Importing the file back restores the diagram.
The PowerPoint diagram is a picture, not native shapes and connectors, so its nodes are not editable one by one in PowerPoint. To change a diagram, edit its source and export again.
Browser loading
In Node and on edge runtimes every diagram type loads with the package. A browser bundle loads only the small engine core (about 12 KB gzipped) and each diagram type the first time a deck draws one. The OPF renderer and editor wait for those loads the way they wait for fonts, and PowerPoint export loads them itself. A host that calls toSvg directly awaits ensureDiagrams(presentation) from @openpresentation/opf/composition first; until then a diagram draws as a loading placeholder, which is not a finding.
Limits and errors
- A source that cannot be parsed reports a finding with its line and column, and the slide shows a “Diagram unavailable” placeholder.
- An empty source, a source over 20,000 characters or a diagram with more than 500 edges is refused the same way.
- In Markdown, an unknown attribute on the fence is
markdown/diagram-attributesand an empty fence ismarkdown/diagram-source.
Try one in Inspector, or see the full field reference in the OPF format reference.